










Contact me

Business intelligence development and consulting

Powered by Expertise. Enhanced by AI.

I build and improve reports, dashboards and data models for finance, operations and management teams, end to end, from connecting source systems through to deployment.

Power BITableauData Studio

P&L variance dashboardDemo report, sample data
Andy Devine
Andy DevineSenior BI Developer & Consultant
10+ years in BIMultiple client contract extensions
Data teams to C‑suiteStakeholder engagement at every level
Available for projects and contractsLondon / Essex / Remote

Client work

Brands I’ve delivered reporting for, directly and through agencies, across aerospace, automotive, finance, media, public health and retail.

Apple
Tesco
Control Risks
TUI
Monsoon
Logimeter
Eurosport
Western Union
Centrica
Farsound

Dashboard examples

A selection of dashboards and reports I've designed and delivered for clients. Client names are removed, and confidential figures are blurred. Select any image to enlarge it.

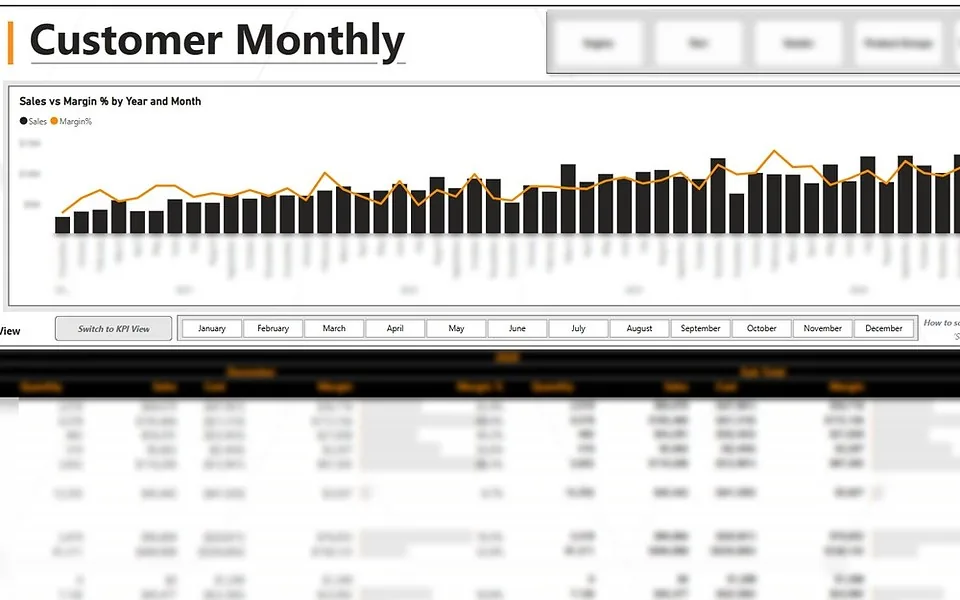
Customer sales & margin trends (Power BI)
Power BI · Finance

Customer sales & margin trends

Monthly sales against margin % by customer, with a multi-year trend.

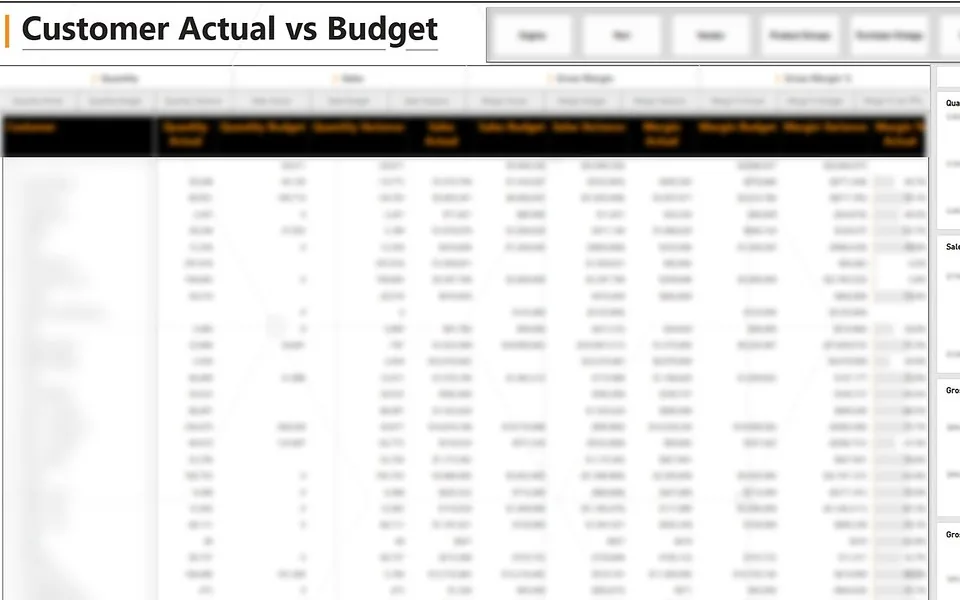
Customer sales & margin vs budget (Power BI)
Power BI · Finance

Customer sales & margin vs budget

Quantity, sales and margin against budget by customer, with period trends. Names, labels and figures obscured.

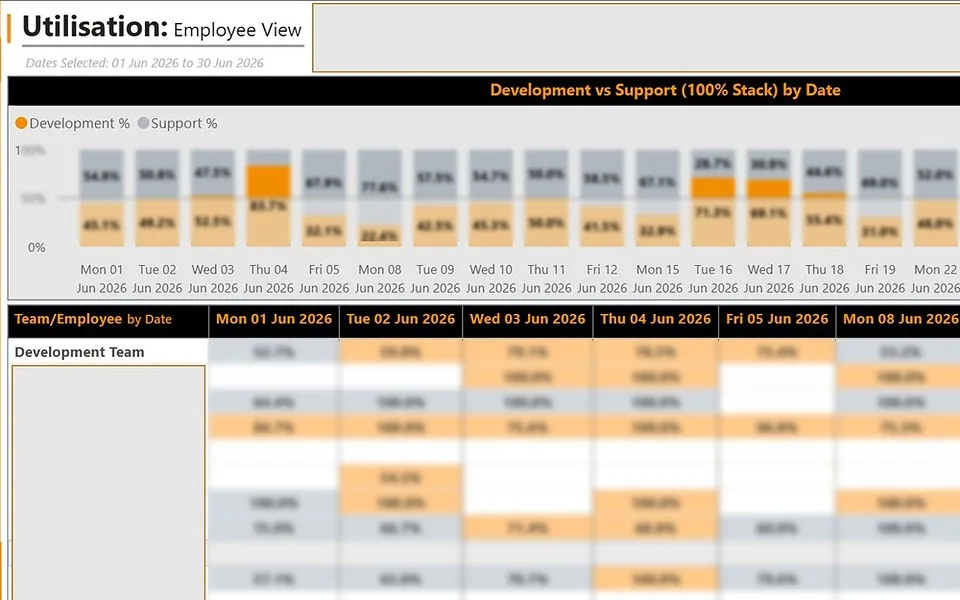
Resource utilisation (Power BI)
Power BI · Operations

Resource utilisation

Development versus support time by team and person, from daily to yearly views.

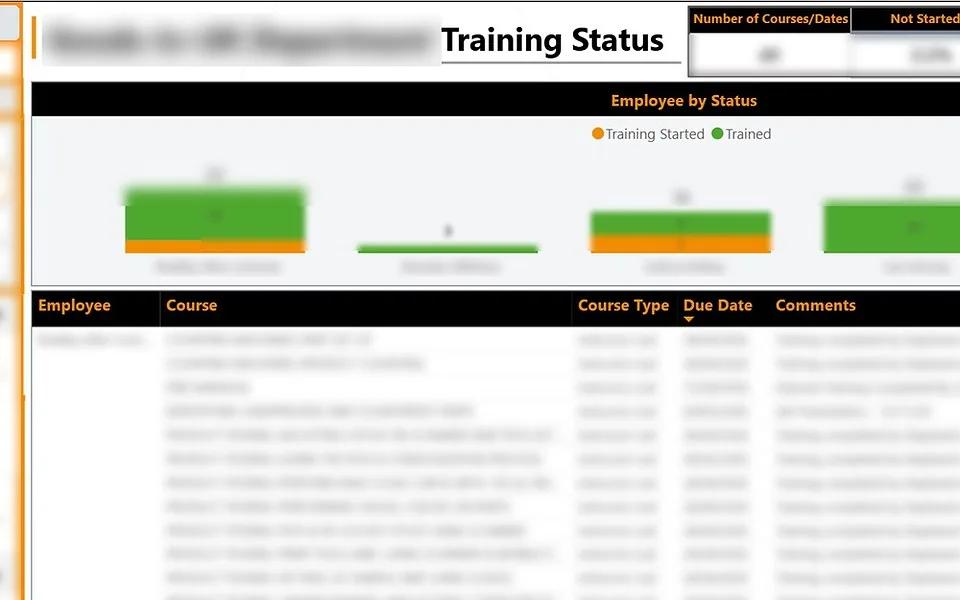
Training status (Power BI)
Power BI · People

Training status

Course completion status by employee and department.

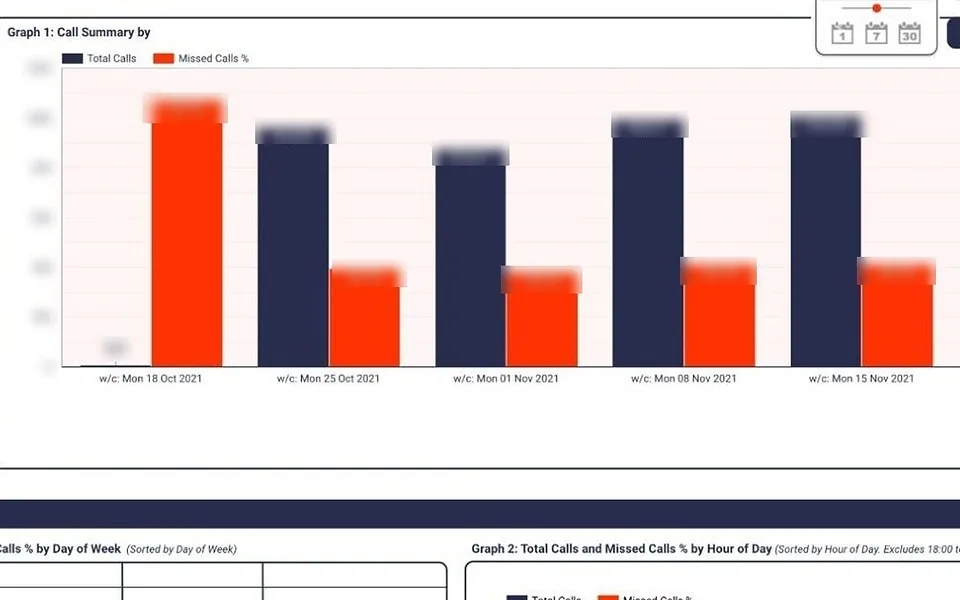
Call tracking & media performance (Data Studio)
Data Studio · Marketing

Call tracking & media performance

Call volumes, missed calls and returning callers by media source.

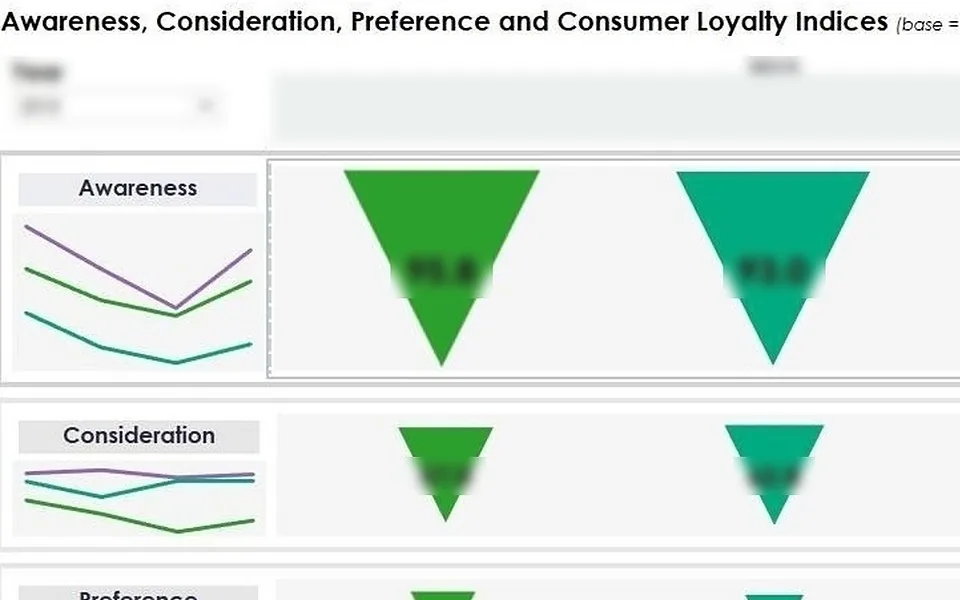
Brand health tracking (Tableau)
Tableau · Research

Brand health tracking

Awareness, consideration, preference and loyalty compared across brands.

More examples
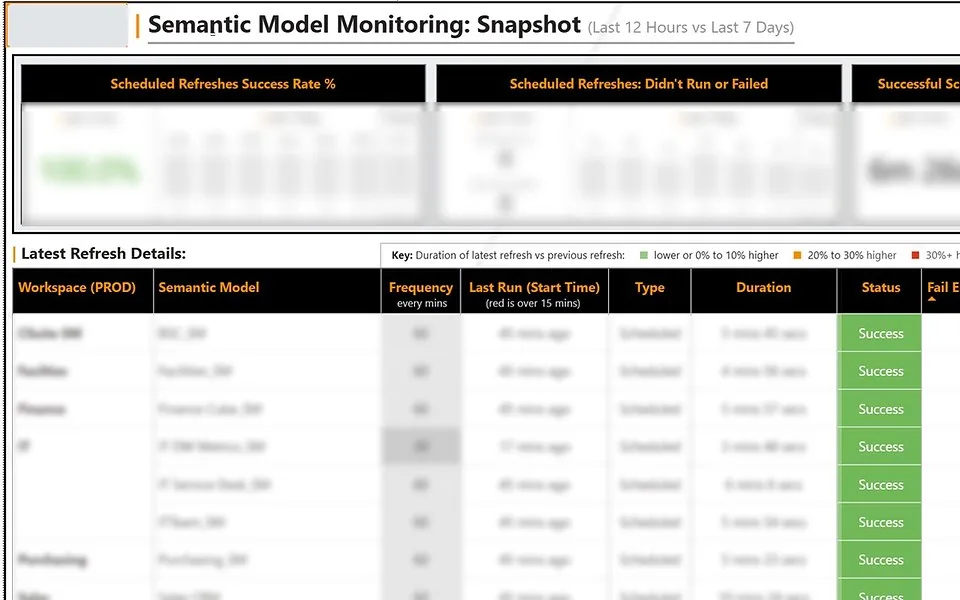
Semantic model monitoring (Power BI)
Power BI · IT

Semantic model monitoring

Refresh success, failures and durations across production models.

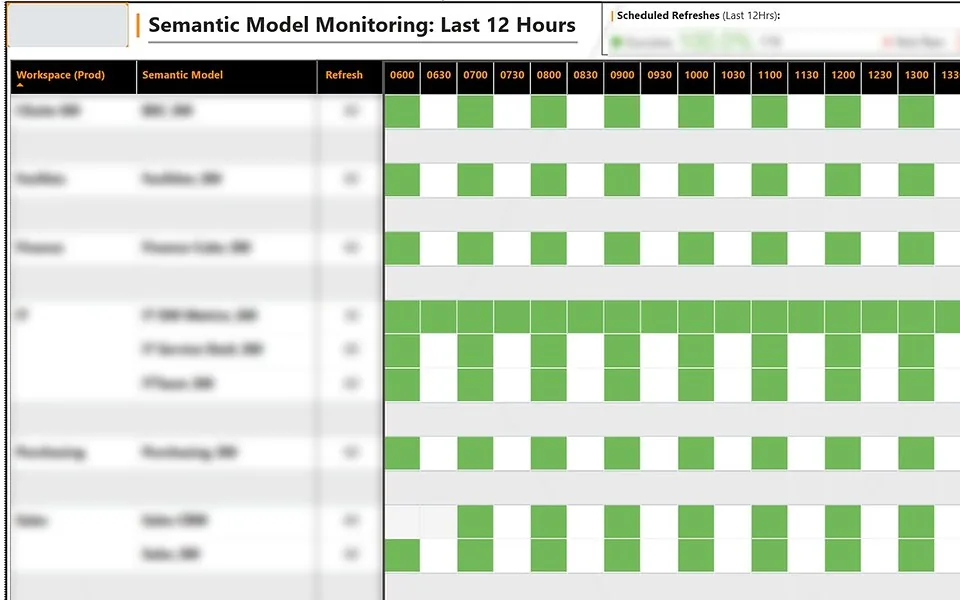
Refresh schedule monitoring (Power BI)
Power BI · IT

Refresh schedule monitoring

Half-hourly and hourly refresh status for every production model over the last 12 hours.

Improvements delivered

Examples of how I've helped organisations modernise reporting, give leaders a clearer view of performance and reduce manual work.

Introduced Power BI best practices and built a C-suite reporting suite

Aerospace · Executive reporting and Power BI development

Outcome
The executive team gained a dedicated reporting suite, and more than a dozen reports across five departments were built on department-specific semantic models and a consistent template.
Challenge and my contribution
Challenge
The business needed to migrate key Excel-based finance reports to Power BI and introduce consistent, best-practice, on-brand reporting.
My contribution
I introduced departmental semantic models for sales, finance, procurement, IT and facilities, organised workspaces, and created reporting templates and brand guidelines. I also built a C-suite reporting suite that included a Financial Report and a Balanced Scorecard.
Built commercial finance reporting for a global consultancy

Global risk consultancy · Finance team

Outcome
The C-suite and global management teams gained a consistent view of client and project profitability, to inform where resources were allocated.
Challenge and my contribution
Challenge
Finance and management teams across international regions and business lines needed consistent, accessible reporting on profitability and resourcing.
My contribution
Working in the finance BI team, I developed Power BI reporting covering project and client profitability, utilisation, timesheet compliance and FTE, drawing on Dynamics 365 and CCH Tagetik data. When the business moved from Dynamics AX to Dynamics 365, I also rebuilt its two main reports for the new system.

Redesigned and expanded an automotive reporting suite

Automotive industry · Reporting covering approximately 1,500 employees

Outcome
A cohesive, branded BI product suite providing reporting across data relating to approximately 1,500 employees.
Challenge and my contribution
Challenge
An existing collection of basic dashboards needed to evolve into a more comprehensive, professionally branded reporting suite, with new reports introduced alongside the client's expanding product offering.
My contribution
I redesigned and enhanced the existing dashboards, established a consistent visual identity aligned with the client's brand, and developed additional reporting products from scratch.

Replaced manual Excel reporting with connected dashboards

Marketing and analytics agency

Outcome
Eight clients received enhanced, connected dashboards in place of manually assembled spreadsheets.
Challenge and my contribution
Challenge
Recurring client reporting involved substantial manual Excel preparation.
My contribution
I developed connected Data Studio dashboards combining analytics, social media and spreadsheet data.

Power BI demos

Built with AI assistance, using sample data.

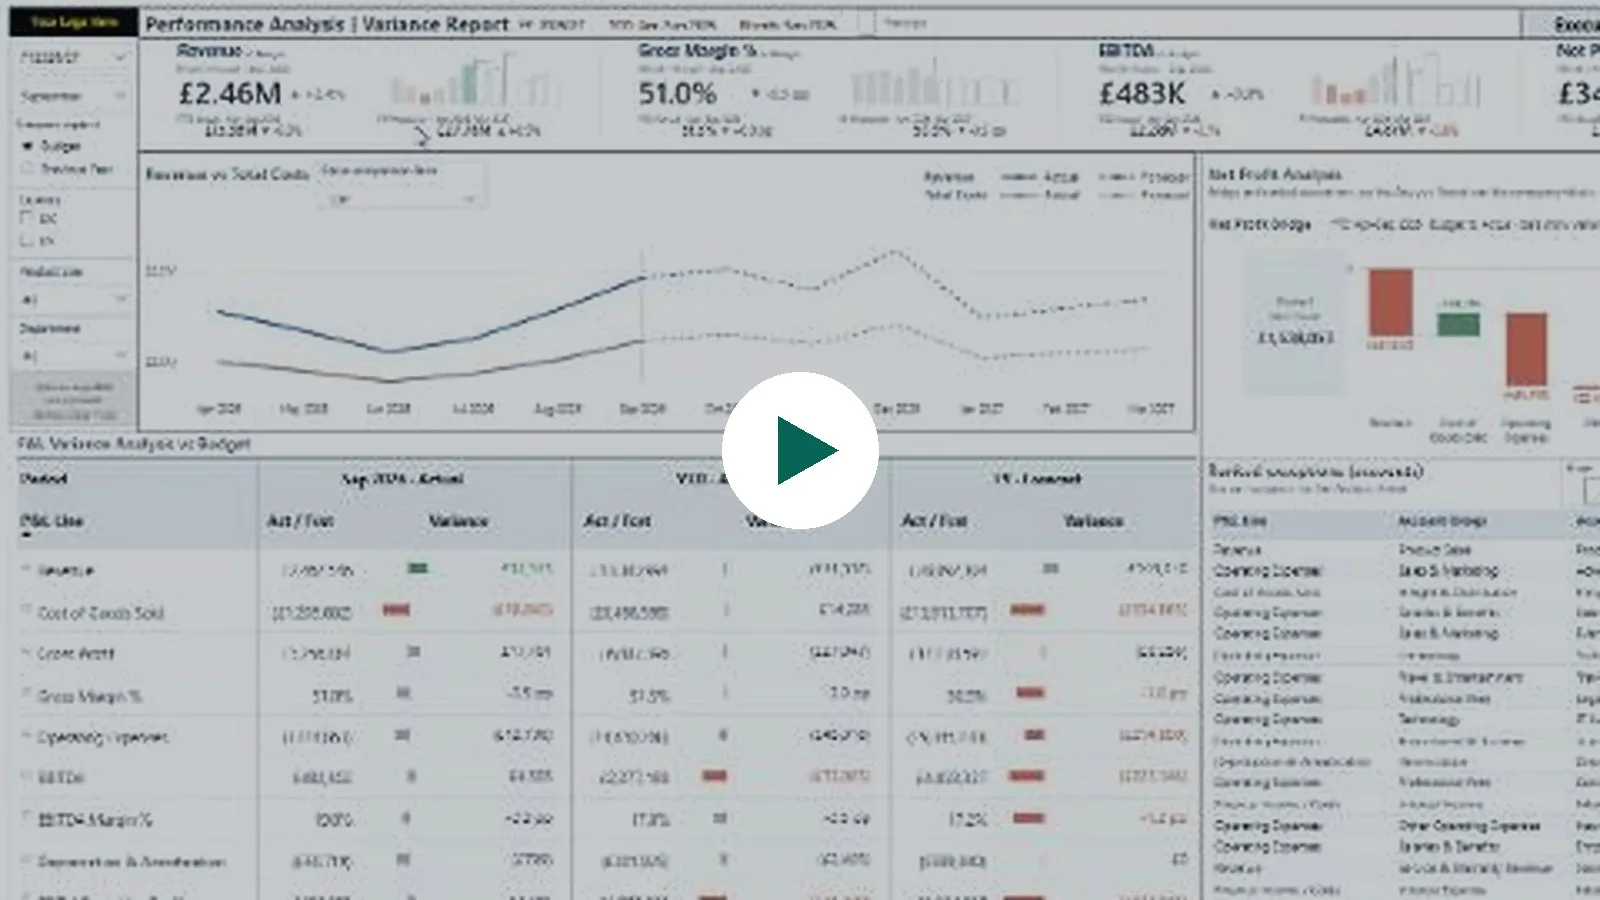
Power BI P&L reporting demo

P&L reporting

A two-page interactive financial reporting demo combining executive KPIs, flexible P&L reporting, forecasting and variance analysis.

  • Executive Summary: Revenue, Gross Margin, EBITDA and Net Profit against Budget and Previous Year, with trends, a Net Profit Bridge and ranked account-level exceptions.
  • Management P&L: choose the period, metrics and comparison: Actual, Budget, Forecast and variance (£ and %).
  • Filter by Country, Product Line and Department, with drill-down, drillthrough and tooltips.
Watch the P&L reporting video
Questions you may have
Can users switch between Budget and Previous Year?
Yes, with £ and % variances. The comparison and reporting period can be changed without rebuilding the report.
How are Actuals and Forecasts handled?
Recorded Actuals are kept separate from Forecast values. The Executive Summary shows a full-year projection, and the Management P&L shows Forecast alongside monthly and year-to-date Actuals.
How does it explain changes in profit?
The Net Profit Bridge breaks the gap between the comparison and Actual Net Profit into its components. Ranked Exceptions then shows which accounts are driving it, sorted by £ impact, % impact or favourable/adverse.
Can it be adapted to our chart of accounts?
Yes. The hierarchy, periods, KPIs and formatting rules can be tailored to how your business measures performance. This starts with reviewing your source data and agreeing reporting definitions and reconciliation.
Can more pages be added?
Yes. The demo is deliberately limited to two pages, and more pages can be added to meet your requirements.
Can users add commentary or update Budget and Forecast?
Not in this demo. Commentary and write-back are possible enhancements, depending on architecture, permissions and data governance.
Is it ready to connect to our finance system?
No, it's a portfolio demo using sample data. A production build would need source-system integration, data quality checks, reconciliation, refresh and security design, performance testing and user acceptance testing.
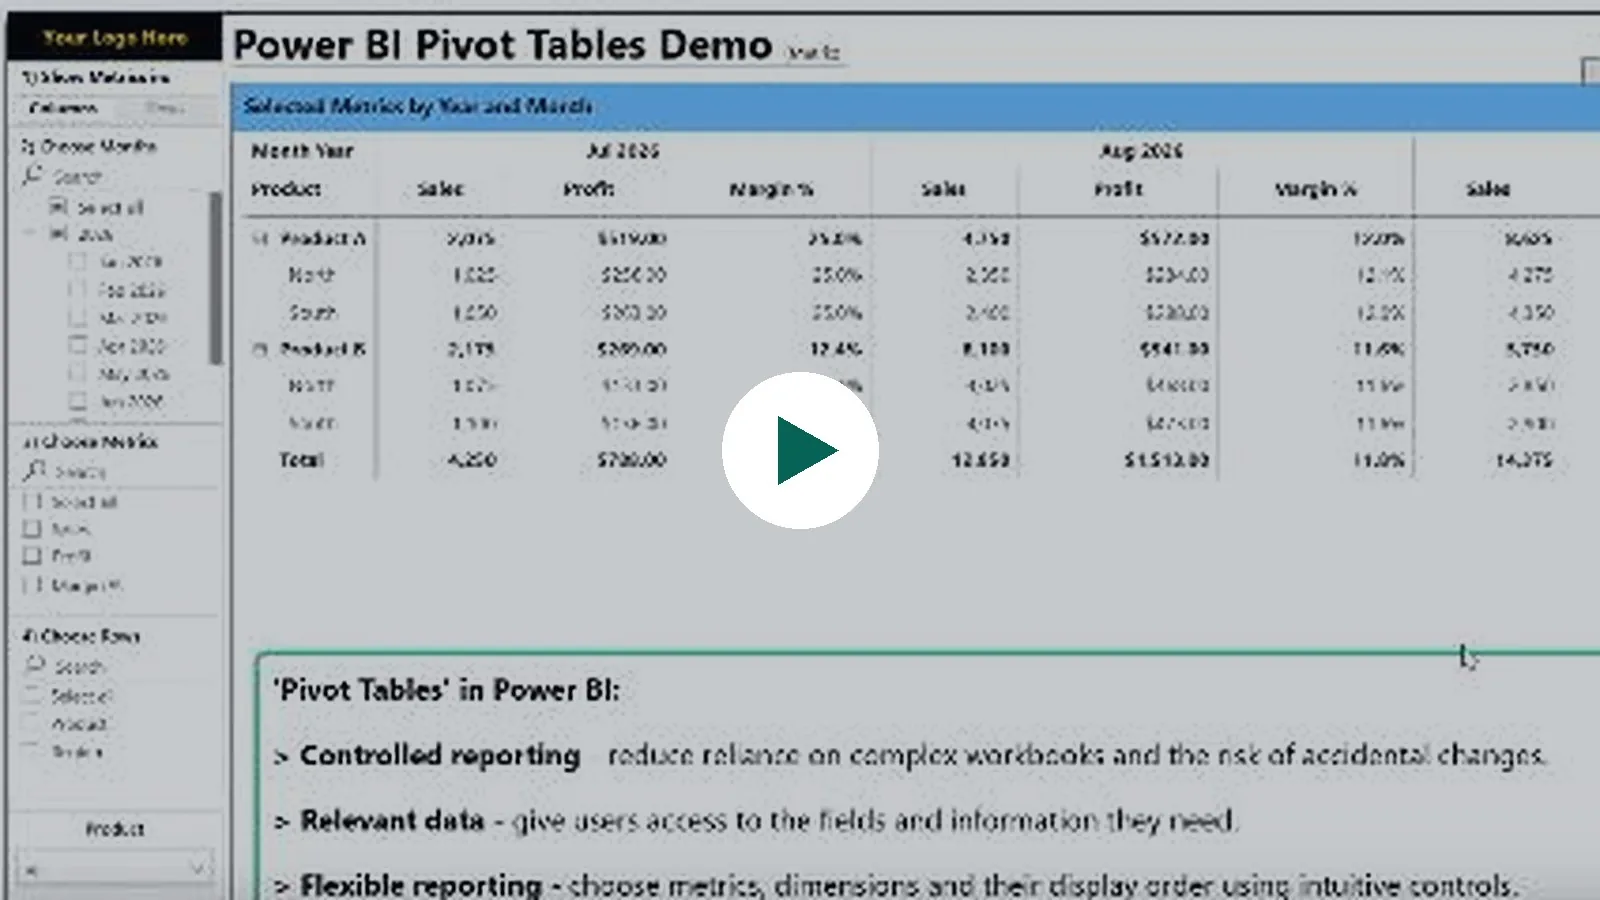
Power BI Excel-style pivot tables demo

Excel-style pivot tables

Think you need Excel for PivotTable-style reporting? The Power BI Matrix can recreate familiar Excel-style reports, with drillthrough, tooltips and interactive visuals added.

  • Users choose the rows, columns and measures from a focused set of fields.
  • Preset layouts, or Customise Matrix View to add and remove fields, all without editing the report.
  • Conditional formatting highlights the figures that matter.
Watch the Excel-style pivot tables video
Questions you may have
Does it do everything an Excel PivotTable does?
Not every feature, but it may cover what you need, and can include drillthrough, tooltips and interactive visuals.
Isn't Excel more flexible?
Excel gives users more freedom to arrange fields and create ad hoc calculations. Power BI offers centrally managed data, controlled access and consistent calculations, and viewers can't edit the underlying data. The right choice depends on your requirements.
Can the layout and visuals differ from the video?
Yes. The demo is deliberately simplified, and layouts, calculations and visuals can be tailored to your reporting.
What kinds of reporting suit this approach?
P&L reporting, sales and profitability analysis, budget vs actual, operational KPIs and management reporting.
How long does it take to build?
It depends on your data, calculations and the functionality you need. I'd review your requirements before giving an estimate.

How I can help

Best practice by default: star-schema models, reusable templates and documented reports.

AI-assisted BI development

I use Claude and the Power BI MCP server to speed up development and documentation, but I own the validation: report figures are reconciled to agreed source totals before anything goes live.

Claude, Power BI MCP

Dashboard design and development

Intuitive, visually engaging dashboards designed around how people work, from project scoping to optimised reports, including mobile layouts in Power BI.

Power BI, Tableau, Data Studio

Financial and management reporting

P&L, budget versus actual and KPI reporting leaders can trust.

Power BI, Excel

Data modelling, integration and validation

Robust, performance-tuned models and numbers that reconcile back to source systems.

SQL Server, Azure SQL, SSAS, DAX, Power Query

Reporting standardisation and modernisation

Consistent, branded report templates and standards, replacing manual spreadsheets and legacy dashboards, with documentation and user training.

Power BI templates, Excel to Power BI

Power BI deployment and governance

Deployment pipelines, scheduled refreshes, workspace management and security, so reporting stays reliable and controlled.

Power BI Service

How I work

  1. ScopeAgree the questions the reporting must answer, the data sources and what success looks like.
  2. BuildDevelop the data model and reports in short cycles, with regular reviews and feedback so you see progress early, and tune them for performance.
  3. ValidateReconcile figures back to source systems and run user acceptance testing before anything goes live.
  4. Hand overDocumentation, walkthroughs and user training so your team can use and maintain what's built.

Engagements: contract roles or fixed-scope projects, on site in London and Essex or remotely.

Your data and AI: client data stays in the client's environment and is only used with AI tools with client approval.

Tools & technologies

The core tools I use day to day. Expand for the full toolkit by area, including deployment, developer tools and what I’m learning.

  • Power BI
  • DAX
  • Power Query
  • SQL
  • Azure SQL
  • SSAS
  • Tabular Editor
  • DAX Studio
  • Tableau
  • Data Studio
See the full toolkit
ReportingPlatformsDataModelling and preparationServiceDeployment and governanceDeveloper toolsBuild, test and optimiseEmergingLearning and exploring
Power BISQLPower BI ServiceTabular EditorMicrosoft Fabric
TableauSQL ServerWorkspace managementDAX StudioDatabricks
Data StudioAzure SQLDeployment pipelinesDAX query viewClaude Code
ExcelPower QueryGatewaysALM ToolkitClaude Data
Data modellingRow-level securityMeasure Killer
SSAS (Analysis Services)Performance Analyzer
DAXClaude
Power BI MCP

Source systems: Microsoft Dynamics 365 (ERP), CCH Tagetik (financial planning and consolidation) and Google BigQuery

Reporting

Platforms
  • Power BI
  • Tableau
  • Data Studio
  • Excel

Data

Modelling and preparation
  • SQL
  • SQL Server
  • Azure SQL
  • Power Query
  • Data modelling
  • SSAS (Analysis Services)
  • DAX

Service

Deployment and governance
  • Power BI Service
  • Workspace management
  • Deployment pipelines
  • Gateways
  • Row-level security

Developer tools

Build, test and optimise
  • Tabular Editor
  • DAX Studio
  • DAX query view
  • ALM Toolkit
  • Measure Killer
  • Performance Analyzer
  • Claude
  • Power BI MCP

Emerging

Learning and exploring
  • Microsoft Fabric
  • Databricks
  • Claude Code
  • Claude Data

What clients and colleagues say

More on LinkedIn

“His contract was extended multiple times”

“Andy worked with us for around 20 months as a Power BI contractor. He took ownership of reporting projects from understanding requirements through to building and delivering reports… He also introduced Power BI report templates and best practices. His contract was extended multiple times, and I'd be happy to recommend him as a Power BI contractor.”

Jim Berry, IT Director, Farsound

“High quality reports for senior stakeholders”

“Andy is able to take a large volume of complex data and produce high quality reports for senior stakeholders. He listens carefully to requirements… His experience and knowledge were recognised throughout the finance function and were highly regarded.”

Ameer Ali, Group Director of Commercial Finance, Control Risks

“A very rare set of skills”

“…these initial dashboards have been significantly transformed and taken our reporting to an entirely new level. Andy possesses a very rare set of skills that enables him to:

  1. Understand, analyse and reshape (via SQL) the underlying raw data
  2. Transform this into online dashboards that present the data in a variety of easy to consume formats and slices
  3. Apply a creative design to the final [dashboards] that give them a level of exceptional visual appeal…

In my experience, these skills usually come from very different resources within an organisation, yet Andy is able to combine all of them effortlessly.”

Wayne Powell, COO, Logimeter
More recommendations

“Following best practice”

“Andy transformed several complex Excel dashboards into Data Studio dashboards, following best practice to create visually engaging reports. I'd recommend Andy to anyone looking for a dashboard contractor.”

Brandwidth, digital agency

“In a short space of time”

“Andy is a diligent, knowledgeable Tableau contractor. He developed a useful, working proof-of-concept dashboard for us in a short space of time.”

MediaCom, media agency

“The design eye to create engaging tools”

“Andy displays all of the skills that you expect from a top drawer PowerBI expert… he possesses a rare mix of technical acumen and expertise but also the design eye to create engaging tools.”

Mike Jenkins, Senior BI Manager, Control Risks

“Excellent understanding of the media landscape”

“Andy had an excellent understanding of the media landscape and ensured that campaigns were measured properly, presenting the insights and analysis to clients.”

TMP Worldwide, recruitment communications agency

Contact me today

Get in touch to discuss your BI requirements or a contract role.

Connect on LinkedIn

Email: info@dashboardanalysts.com

Your details are only used to reply to your enquiry and are never sold or used for marketing. See the privacy notice.

View my workContact me